Offensive lines play an enormous role when it comes to success at the running back position. The consistent production that coaches such as Mike Shanahan and even Jeff Fisher have received from a variety of runners suggests the extent to which offensive lines contribute to that production.
Sometimes even just marginal talent is all a running back needs as long as he can consistently gain the yards expected of him, since his offensive line is doing all the hard work of getting him lots of yardage in the first place.
For DFS purposes, we might be tempted to consider the talent of a running back’s offensive line when deciding whether to roster him. But what should we consider when evaluating running backs for DFS?
The Importance of Success Rate
The best way to gauge sustainability and consistency at the running back position is through Success Rate (SR). Per Football Outsiders, a run is a success if it satisfies one of the following criteria:
– A player gains 40 percent of yards-to-go on first down, 60 percent on second down, and 100 percent on third down.
– If team is behind by more than a touchdown in the fourth quarter, the benchmarks switch to 50, 65, and 100 percent.
– If team is ahead by any amount in the fourth quarter, the benchmarks switch to 30, 50, and 100 percent.
Since some offensive lines are better than others, it’s reasonable to assume that some running backs have SRs that don’t align with their talent levels.
So which offensive lines help their running backs overachieve when it comes to the SR metrics? And which offensive lines hinder their runners?
Expected Success Rate
I’ve created a metric that allows us to quantify the level of success we can expect behind each team’s offensive line. With this metric, we can see if a player is meeting his line-adjusted expectations. I call this metric ‘Expected Success Rate’ (eSR).
Using play-by-play data I charted every ‘Team Success Rate’ (TSR) for every team dating back to 2000. I then performed a linear regression using as a second variable Adjusted Line Yards (ALY) for the same time period, which yielded a sample size of nearly 700,000 NFL plays. ALY is the perfect second variable as it attempts to quantify the quality of running back play independent of offensive line play.
The following is the result of that linear regression for the fifteen-year sample:

The chart shows an almost 60 percent correlation between ALY and TSR. In other words, 60 percent of what we see from running backs can be attributed to offensive line play.
This isn’t to say that anyone can be an NFL running back — but this data clearly suggests that a running back’s talent is less important to his success than is the talent of his blockers.
Does This Matter for DFS?
Maybe we should use this metric in DFS to search for upside in players who are ‘expected’ to produce high SRs due to their offensive lines? Right?
Wrong.
Many people may look at offensive line strength and think that they should invest in runners because of that. The reality is that, despite its value in the NFL, the value of offensive line play in DFS is vastly overstated.
The following chart displays the correlation on DraftKings between eSR and 2015 DFS performance (as measured by our Plus/Minus metric). Each running back in the sample had an average of 10-plus rushing attempts per game in 2015.

As you can see from the scatter plot, the correlation between offensive line effectiveness and Plus/Minus is effectively non-existent.
You must resist the urge to let offensive line production impact your decision-making process. Not only are running backs behind good lines likelier to be higher-owned in tournaments, but platforms also seem to take offensive line strength into account in their pricing.
For DFS performance, eSR — or looking at offensive lines — provides no edge whatsoever.
So How Do We Get An Edge?
What ultimately matters in DFS isn’t who is blocking for a runner but how often he touches the ball and how many times per game he is on the field. It is clear that opportunity is everything for running backs. Almost always we should prioritize volume over efficiency.
Related to this is the idea that talent is probably overvalued by a lot of people and in truth is almost irrelevant. Rostering talented running backs with elite skill-sets is fun, but it provides you with a false sense of security. The majority of points in DFS at this position come from a healthy dose of touches and snaps.
Volume Over Efficiency
Total touches have a stronger correlation to running back fantasy points than any efficiency metric.
The average SR in the NFL is 44.3 percent. Here’s how runners with better-than-average SRs do on DraftKings:

And here’s how running backs with an average of 10-plus rushing attempts per game over the last year do on DraftKings:

Intuitively it makes sense that the more opportunities you get to touch the ball the more chances you will have to score fantasy points, but it’s surprising how little an efficiency metric like SR actually matters in DFS for running backs.
Don’t Sleep on the Importance of Snap Counts
The importance of snap counts in DFS is highly underrated. It is a great statistic because a player’s role (or input) tends to be more stable than his yardage and touchdowns (or output), which can carry quite a bit of variance.
Additionally, yardage and touchdowns can have a much bigger impact on a player’s salary than snap count does. We can see a player instantly become overvalued after a good game even if he doesn’t play many snaps. And a player who receives more snaps but has no increase in production often will not have a significantly higher salary the following week.
Snaps are extremely important when talking about volume.
Game scripts can be very unpredictable. If a team is victim to poor game flow then snap counts become that much more important. Even if a back isn’t getting the carries he otherwise might, perhaps he can compensate with targets in the passing game. That’s possible, because he’s at least on the field.
Takeaways
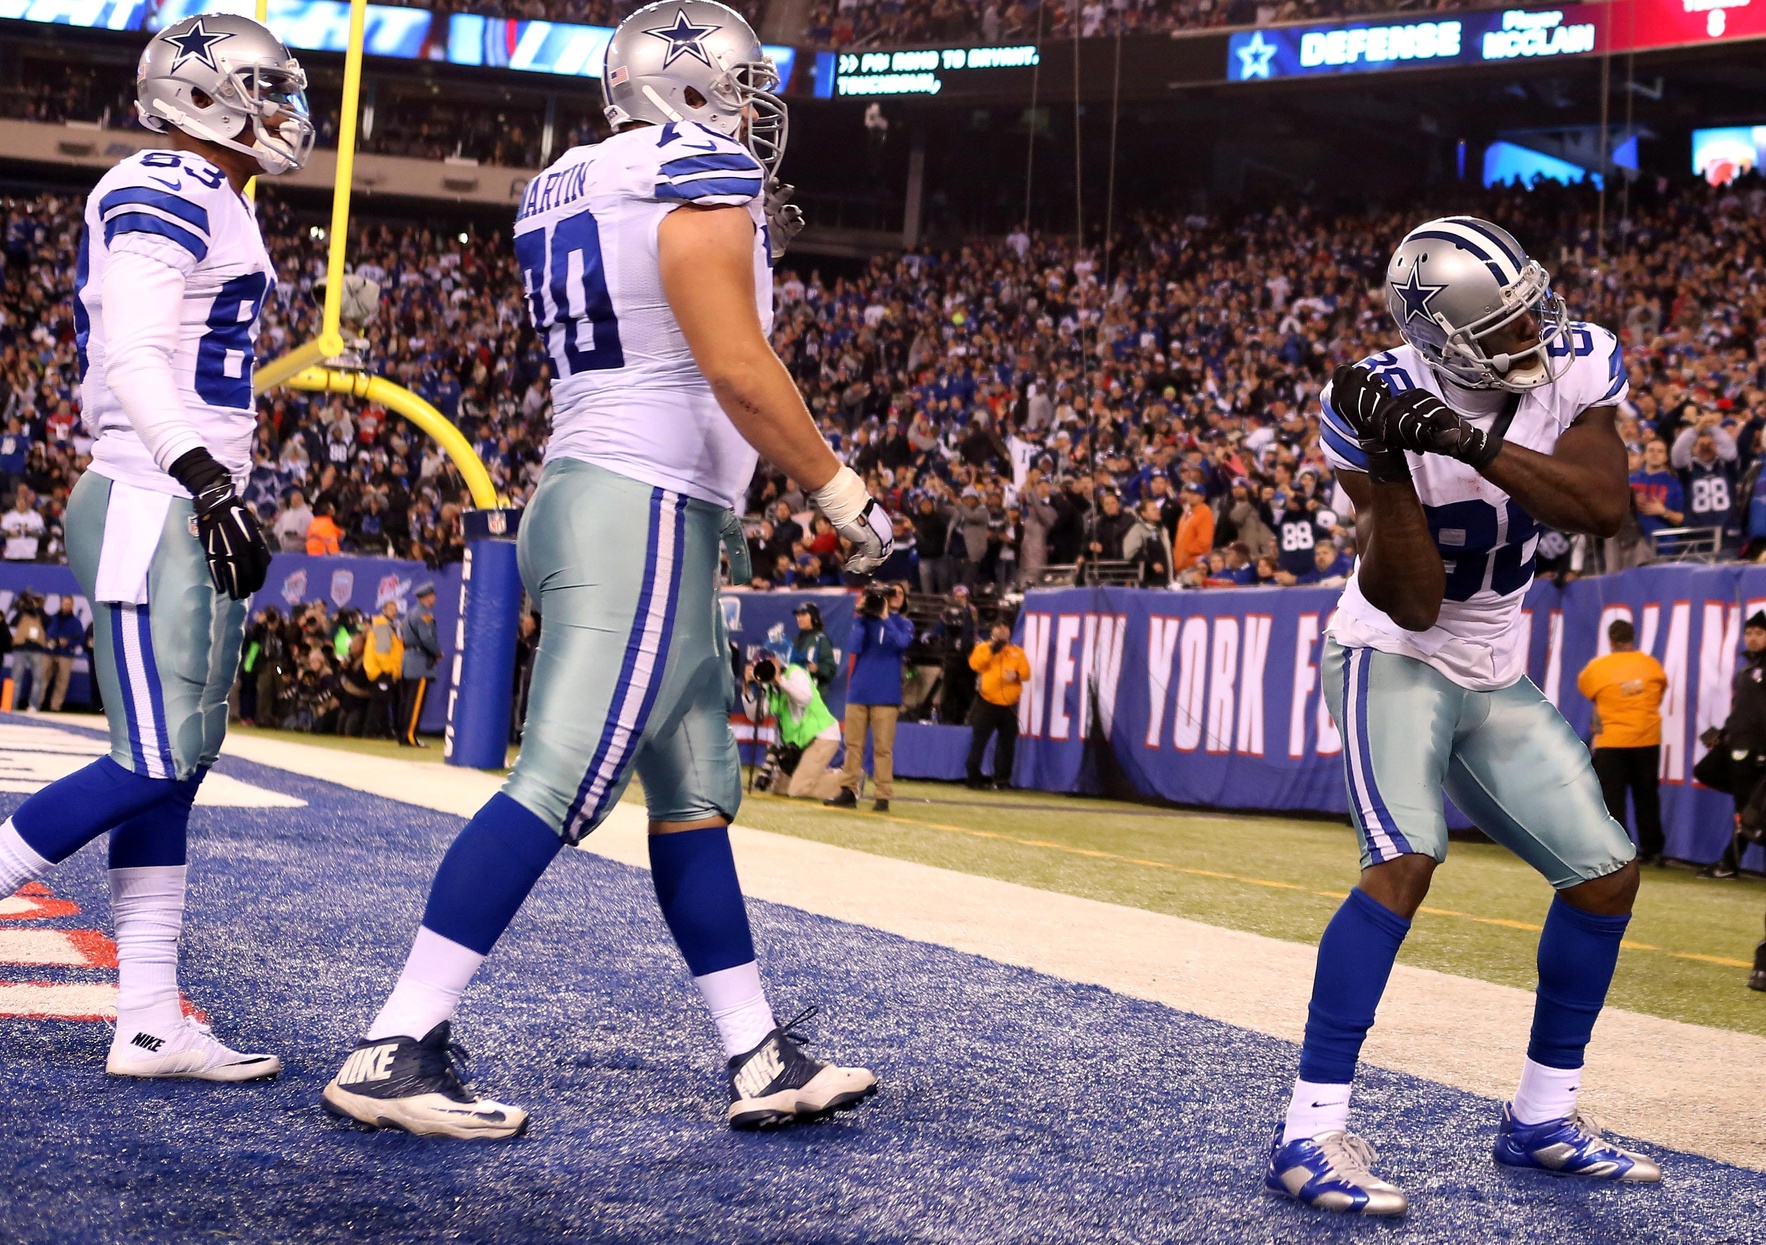
Take a player like Ezekiel Elliott. He will benefit from the Cowboys offensive line and might have a phenomenal season — but from a DFS perspective that great offensive line is at best irrelevant and at worst misleading, as it could cause him to be over-owned in tournaments.
From a DFS example, what’s important about Elliott is not that the Cowboys have invested heavily in their offensive line. What’s important is that the Cowboys are likely to feed their first-round pick the ball a ton. THAT is what really matters.
Elliott may be an extreme example, but he illustrates the general point well. You should not worry about how strong a team’s offensive line is when deciding which running backs to roster. You should worry most about finding players who are going to see large workloads.